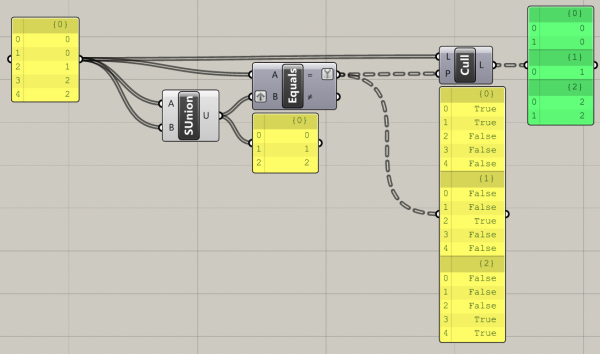
This is my self-explanatory solution to the problem (Union all of the data, and put them in each branch wether match or not). I decided to post this 2013 solution of mine after watching a 2014 C# tackling of the problem.
This is my self-explanatory solution to the problem (Union all of the data, and put them in each branch wether match or not). I decided to post this 2013 solution of mine after watching a 2014 C# tackling of the problem.
Researching implies producing lots of PDF’s. Sometimes these PDF’s are exported without much control and become several MB large, which is inconvenient to send out to some else (e-mail) or even to the cloud or a printer. To deal with this issue, a common solution is to down sample the images in your PDF to […]
This is my self-explanatory solution to the problem (Union all of the data, and put them in each branch wether match or not). I decided to post this 2013 solution of mine after watching a 2014 C# tackling of the problem.
This Blender add-on is a fork I modified from the original “Import Wavefront (.obj)” which ships with the official Blender release. The motivation for the creation of this modification is the maintenance of materials upon importing new geometry. A common workflow in architecture visualization is the iterative import of exported models from other software, such […]
This definition is the interior of a cluster I created that allows for the culling of duplicate items of any type based on a criteria. In this case, we are culling lines based on their mid point. Use the criteria carefully.
I created a quick Google Sheet to calculate the end time of a process based in the percentage done and time elapsed. Free for anyone to use! Google Sheet – Process time calculator
Contrary to most people I meet, I am a Magic Mouse fan. I never had any wrist pain, and I love the 2D touch scroll. Having said that, the mouse comes with some incompatibilities with graphical software packages, namely Blender and Rhino Grasshopper. This post is about the latter. To make the Grasshopper canvas Zoom […]
You can reach here for the interactive chart. The COVID-19 outbreak has been the subject of various studies and infographics. One of the most used is the Visual Dashboard by Johns Hopkins CSSE. I created this tool because I wanted to be able to compare statistics between two countries, and I haven’t found any tool […]
I had a dream… for a long time. Be able to easily compare climbs from GPX data. Some years ago, I built a Grasshopper GPX compare tool, with 3D visualization and such… but not useful for the everyday person. So now, thanks to some AI help, I have built a webpage that takes care of […]
While using Grasshopper, I’ve been many times confronted with the task of smoothly varying a list of number to achieve some formal effect through number control. Be it a curvature or height control, the problem here deals with easily transforming a list of numbers into another with some of the values smoothly changed. I decided […]
It is quite common to find people confused by the notion of DPI and its influence in media size. DPI is nothing else than the relation between virtual dimension (pixels) and real dimension (inches/centimeters). To ease this understanding and everyday calculations, I created this simple spreadsheet in Google Docs accessible to anyone. You just need […]
All content © Copyright 2026 by Pedro de Azambuja Varela.
Subscribe to RSS Feed