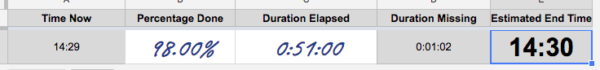
I created a quick Google Sheet to calculate the end time of a process based in the percentage done and time elapsed. Free for anyone to use!
Google Sheet – Process time calculator
I created a quick Google Sheet to calculate the end time of a process based in the percentage done and time elapsed. Free for anyone to use!
Google Sheet – Process time calculator
You can reach here for the interactive chart. The COVID-19 outbreak has been the subject of various studies and infographics. One of the most used is the Visual Dashboard by Johns Hopkins CSSE. I created this tool because I wanted to be able to compare statistics between two countries, and I haven’t found any tool […]
This definition is the interior of a cluster I created that allows for the culling of duplicate items of any type based on a criteria. In this case, we are culling lines based on their mid point. Use the criteria carefully.
While using Grasshopper, I’ve been many times confronted with the task of smoothly varying a list of number to achieve some formal effect through number control. Be it a curvature or height control, the problem here deals with easily transforming a list of numbers into another with some of the values smoothly changed. I decided […]
Another take on the problem of shaping a list of numbers according to a graph visual definition. The reason for not applying a Graph Mapper component directly deals with the way Graph Mapper has its settings adjusted. These are accessible through a double-click on the component, disallowing any kind of parametric adjustments (as with the […]
Researching implies producing lots of PDF’s. Sometimes these PDF’s are exported without much control and become several MB large, which is inconvenient to send out to some else (e-mail) or even to the cloud or a printer. To deal with this issue, a common solution is to down sample the images in your PDF to […]
One of the features I have learned to love in Rhino is the Print to JPG feature. Unfortunately, this is still not available to Rhino 5 for Mac users, but there is a solution. The secret is using the ViewCaptureToFile command in its command line variant, -ViewCaptureToFile. From here, you can type the full path or […]
I had a dream… for a long time. Be able to easily compare climbs from GPX data. Some years ago, I built a Grasshopper GPX compare tool, with 3D visualization and such… but not useful for the everyday person. So now, thanks to some AI help, I have built a webpage that takes care of […]
I created a quick Google Sheet to calculate the end time of a process based in the percentage done and time elapsed. Free for anyone to use! Google Sheet – Process time calculator
This is my self-explanatory solution to the problem (Union all of the data, and put them in each branch wether match or not). I decided to post this 2013 solution of mine after watching a 2014 C# tackling of the problem.
Dithering is a technique to avoid banding or moire patterns. This technique consists in a probabilistic choice of values instead of a deterministic one. Photoshop has a dithering filter called “Spatter”, while Gimp offers precise options for dithering purposes. However, using an external image editor to reduce the range of a number of values is […]
All content © Copyright 2026 by Pedro de Azambuja Varela.
Subscribe to RSS Feed