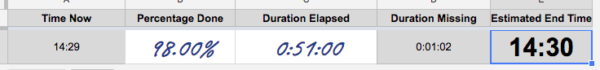
I created a quick Google Sheet to calculate the end time of a process based in the percentage done and time elapsed. Free for anyone to use!
Google Sheet – Process time calculator
I created a quick Google Sheet to calculate the end time of a process based in the percentage done and time elapsed. Free for anyone to use!
Google Sheet – Process time calculator
This Blender add-on is a fork I modified from the original “Import Wavefront (.obj)” which ships with the official Blender release. The motivation for the creation of this modification is the maintenance of materials upon importing new geometry. A common workflow in architecture visualization is the iterative import of exported models from other software, such […]
Grasshopper does not seem to have the “pick region” feature from the Rhino Hatch command. I have created such an algorithm, taking advantage of recursive computing provided by the Hoopsnake plugin. You can download the .gh file here: FindRegion.gh The overall idea of the algorithm is to find the curve that has the shortest angle relative […]
Contrary to most people I meet, I am a Magic Mouse fan. I never had any wrist pain, and I love the 2D touch scroll. Having said that, the mouse comes with some incompatibilities with graphical software packages, namely Blender and Rhino Grasshopper. This post is about the latter. To make the Grasshopper canvas Zoom […]
I created a quick Google Sheet to calculate the end time of a process based in the percentage done and time elapsed. Free for anyone to use! Google Sheet – Process time calculator
You can reach here for the interactive chart. The COVID-19 outbreak has been the subject of various studies and infographics. One of the most used is the Visual Dashboard by Johns Hopkins CSSE. I created this tool because I wanted to be able to compare statistics between two countries, and I haven’t found any tool […]
Dithering is a technique to avoid banding or moire patterns. This technique consists in a probabilistic choice of values instead of a deterministic one. Photoshop has a dithering filter called “Spatter”, while Gimp offers precise options for dithering purposes. However, using an external image editor to reduce the range of a number of values is […]
This is my self-explanatory solution to the problem (Union all of the data, and put them in each branch wether match or not). I decided to post this 2013 solution of mine after watching a 2014 C# tackling of the problem.
A friend of mine who has been a long time SketchUp user has recently asked me how to do push pull in Rhino. Here is my take: Execute the command SplitFace If you want to split by a line, simply draw it (activate Near or other OSnap recommended) You have the option to split by an existing (previously drawn) […]
The AVG daytime is the temperature average from 7:00 to 20:00.
Researching implies producing lots of PDF’s. Sometimes these PDF’s are exported without much control and become several MB large, which is inconvenient to send out to some else (e-mail) or even to the cloud or a printer. To deal with this issue, a common solution is to down sample the images in your PDF to […]
All content © Copyright 2026 by Pedro de Azambuja Varela.
Subscribe to RSS Feed