This definition is the interior of a cluster I created that allows for the culling of duplicate items of any type based on a criteria. In this case, we are culling lines based on their mid point. Use the criteria carefully.
This definition is the interior of a cluster I created that allows for the culling of duplicate items of any type based on a criteria. In this case, we are culling lines based on their mid point. Use the criteria carefully.
I created a quick Google Sheet to calculate the end time of a process based in the percentage done and time elapsed. Free for anyone to use! Google Sheet – Process time calculator
The AVG daytime is the temperature average from 7:00 to 20:00.
In this little algorithm I build a single mesh for each face of the parent mesh. One of the great challenges is the duplication of data (Vertices) as to feed the Faces component.
A renewed interest in stereotomy, narrowly entwined with digital technologies, has allowed for the recovery and proposal of new techniques and expressions in this building approach. A new classification scheme for stereotomy research allows for the framing of various aspects related to this discipline, including a newly developed fabrication system specially tailored for the wedge-shaped […]
You can reach here for the interactive chart. The COVID-19 outbreak has been the subject of various studies and infographics. One of the most used is the Visual Dashboard by Johns Hopkins CSSE. I created this tool because I wanted to be able to compare statistics between two countries, and I haven’t found any tool […]
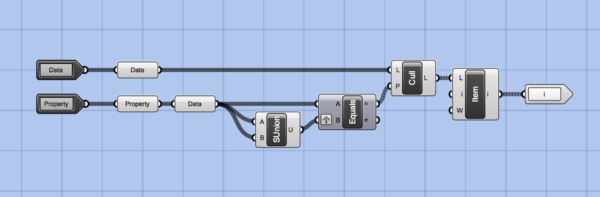
This is my self-explanatory solution to the problem (Union all of the data, and put them in each branch wether match or not). I decided to post this 2013 solution of mine after watching a 2014 C# tackling of the problem.
Another take on the problem of shaping a list of numbers according to a graph visual definition. The reason for not applying a Graph Mapper component directly deals with the way Graph Mapper has its settings adjusted. These are accessible through a double-click on the component, disallowing any kind of parametric adjustments (as with the […]
Dithering is a technique to avoid banding or moire patterns. This technique consists in a probabilistic choice of values instead of a deterministic one. Photoshop has a dithering filter called “Spatter”, while Gimp offers precise options for dithering purposes. However, using an external image editor to reduce the range of a number of values is […]
One of the features I have learned to love in Rhino is the Print to JPG feature. Unfortunately, this is still not available to Rhino 5 for Mac users, but there is a solution. The secret is using the ViewCaptureToFile command in its command line variant, -ViewCaptureToFile. From here, you can type the full path or […]
This Blender add-on is a fork I modified from the original “Import Wavefront (.obj)” which ships with the official Blender release. The motivation for the creation of this modification is the maintenance of materials upon importing new geometry. A common workflow in architecture visualization is the iterative import of exported models from other software, such […]
All content © Copyright 2026 by Pedro de Azambuja Varela.
Subscribe to RSS Feed